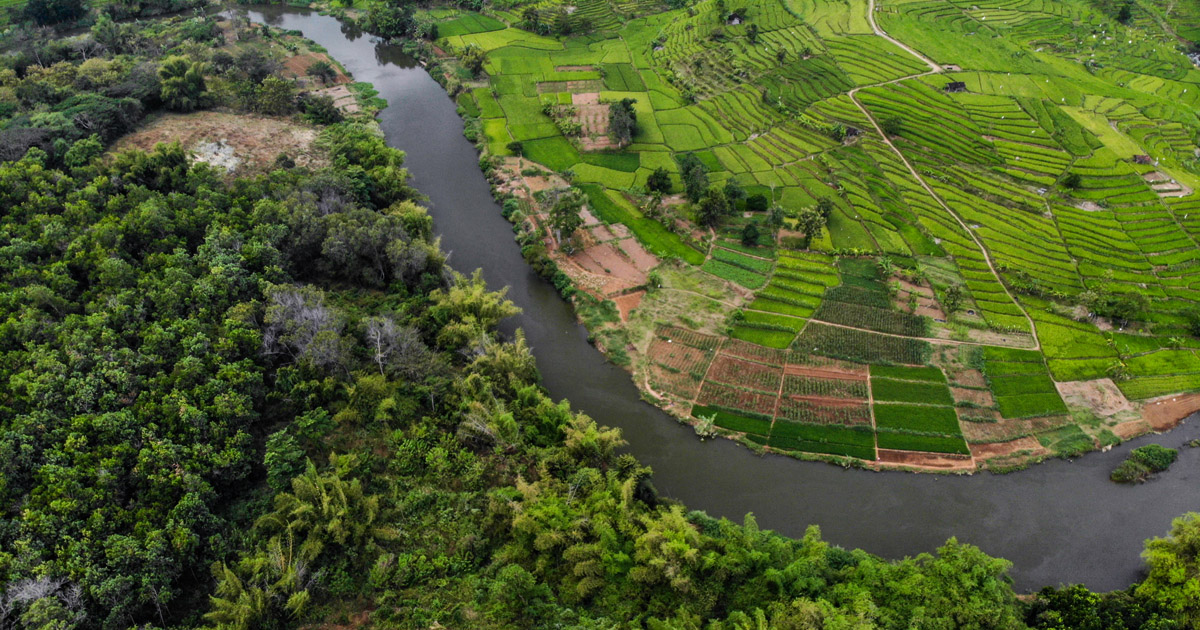
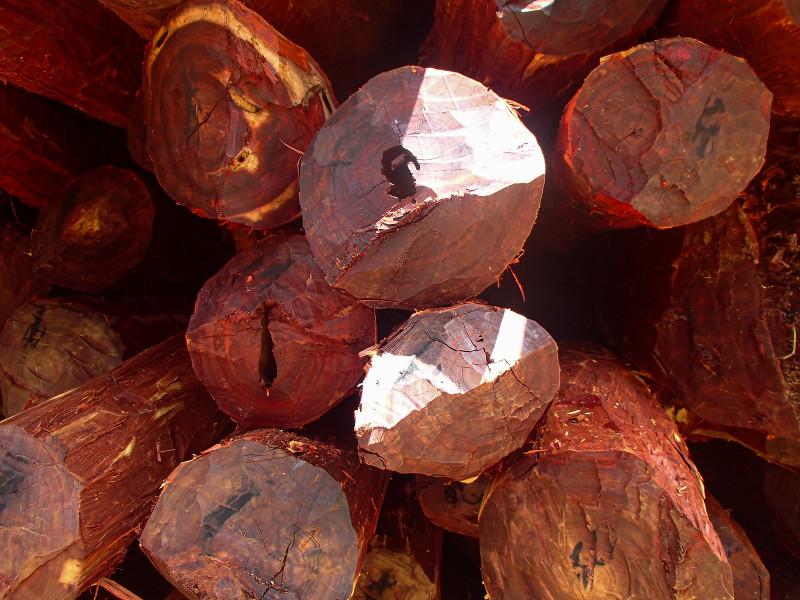
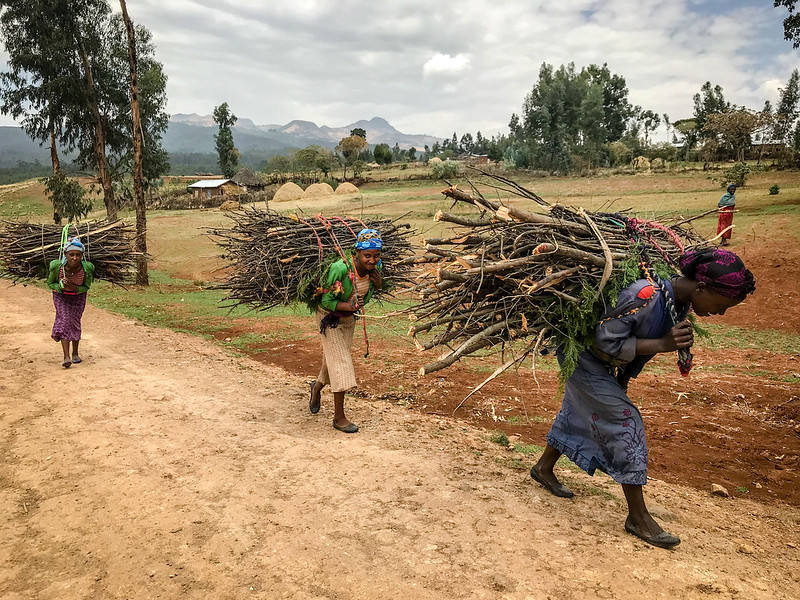
This paper presents a map of Africa's rainforests for 2005. Derived from moderate resolution imaging spectroradiometer data at a spatial resolution of 250 m and with an overall accuracy of 84%, this map provides new levels of spatial and thematic detail. The map is accompanied by measurements of deforestation between 1990, 2000 and 2010 for West Africa, Central Africa and Madagascar derived from a systematic sample of Landsat images—imagery from equivalent platforms is used to fill gaps in the Landsat record. Net deforestation is estimated at 0.28% yr-1 for the period 1990-2000 and 0.14% yr-1 for the period 2000-2010. West Africa and Madagascar exhibit a much higher deforestation rate than the Congo Basin, for example, three times higher for West Africa and nine times higher for Madagascar. Analysis of variance over the Congo Basin is then used to show that expanding agriculture and increasing fuelwood demands are key drivers of deforestation in the region, whereas well-controlled timber exploitation programmes have little or no direct influence on forest-cover reduction at present. Rural and urban population concentrations and fluxes are also identified as strong underlying causes of deforestation in this study.
Download:
DOI:
https://doi.org/10.1098/rstb.2012.0300
Altmetric score:
Dimensions Citation Count:


